My Students' Work
Below is a sample of some of the work my students have created. They used a variety of high and low tech technology for the various activities. As I've learned in my master's, its not how much technology you use, its how you use the technology. Many of the activities were done in groups of two or three so students could have discussions and process the patterns they were observing.
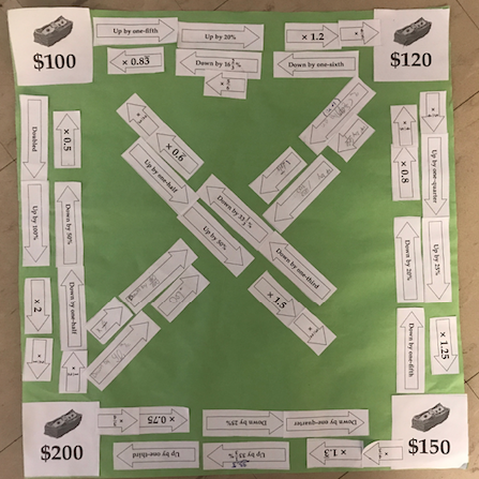
Math Plus: Percent Increase and Decrease Exploration
|
Previously students worked on converting between decimals, percents, and fractions. They studied percent problems like finding the amount of tip and total amount of bill with the tip. This activity helped the students discover one step ways to complete percent increase and decrease problems. For this multi-day activity, students worked in groups of two to discover multiple ways to represent a percent increase or a percent decrease. The students started by placing the four dollar values on the corners. Then using guess and check on a calculator, they placed the decimal multipliers for the increase and decrease. The rest of the arrows where placed using conversion skills or guess and check. The students even had to come up with their own numbers to go from $200 to $120 and from $120 to $200. In the end, the groups made generalizations for different ways to do a percent increase and percent decrease problems.
|
|
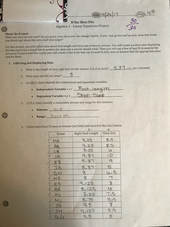
Algebra I: If the Shoe Fits Project
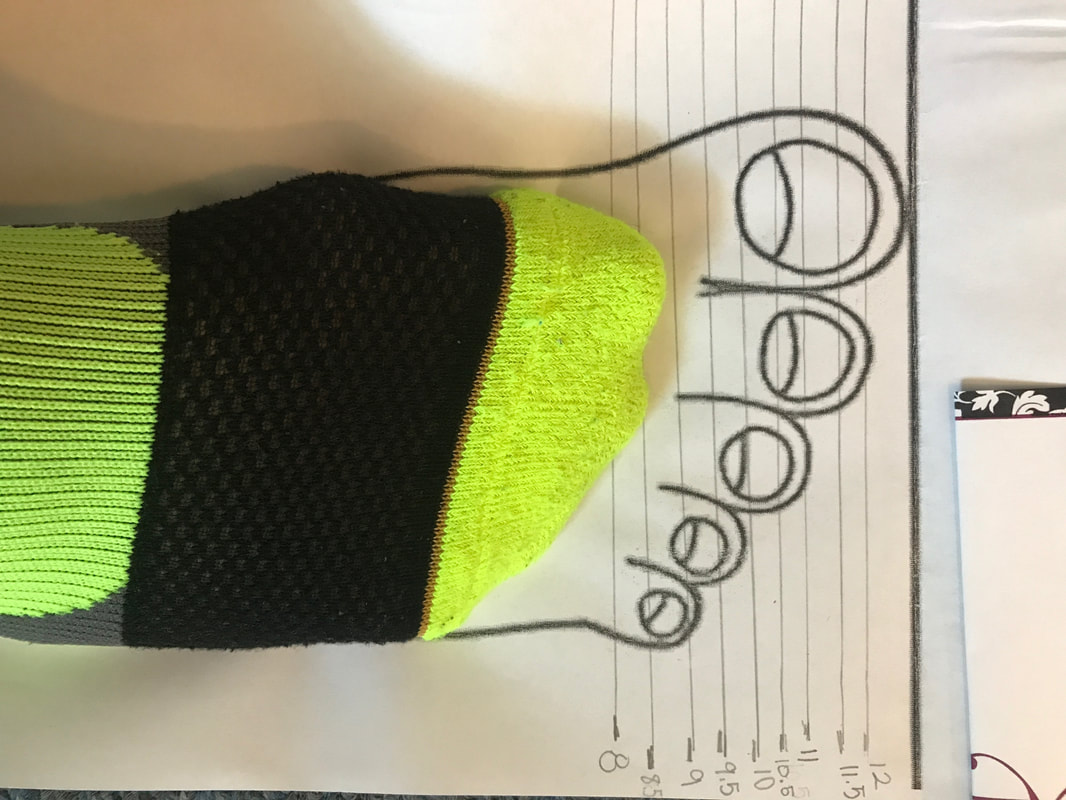
I normally buy a women's size 8.5 shoe. According to this student's project, I should wear a women's size 9.
|
This project is the culminating activity after the students learned about linear equations. For this project, students used real life data to make a foot scale (similar to the metal ones at the store) to determine a person's shoe size based on the length of their right foot. Although the students were able to work with a partner for this project, their data and their partner's data could not be the same. First the students collected data (length of foot and shoe size) from their male or female classmates. Then they created a scatter plot and modeled the data with a linear trend line. They wrote a linear equation for the trend line and used it to predict the shoe size for several different foot lengths. To judge the accuracy of their trend line, students used a graphing calculator to find the equation for the linear line of best fit (most accurate linear trend line). They used the equation for the line of best fit to predict the shoe size for the same foot lengths as before. They looked for major differences between the line of best fit and trend line predictions and explained how these might have occurred. Finally, students made a foot scale (using the line of best fit) that can be used by anyone with a foot from 8.875 inches to 12.5 inches long.
|
Math 8: Part 2 - Exploring Reflections
|
Before completing this exploration students completed a similar exploration to discover the properties and rules of translations. During the previous class period, students performed reflections on GeoGebra and discovered some of their properties. To complete Part 2 - Exploring Reflections, students worked in groups of two. They each had a netbook. One netbook had the Google Doc open so they could record their observations and generalizations. The other netbook had the GeoGebra activity open so they could perform the reflections, see the coordinates of the image and preimage, and try multiple examples just by dragging the preimage to a new location. After completing a few examples of the same type of reflection, the students noticed patterns between the coordinates of the preimage and coordinates of the image. The students were able to make generalizations about the coordinates of an image following a reflection over the x-axis, y-axis, y = x, and y = -x. After completing Part 2 - Exploring Reflections student were able to use their reflection rules to perform reflections instead of doing the reflections by hand.
|
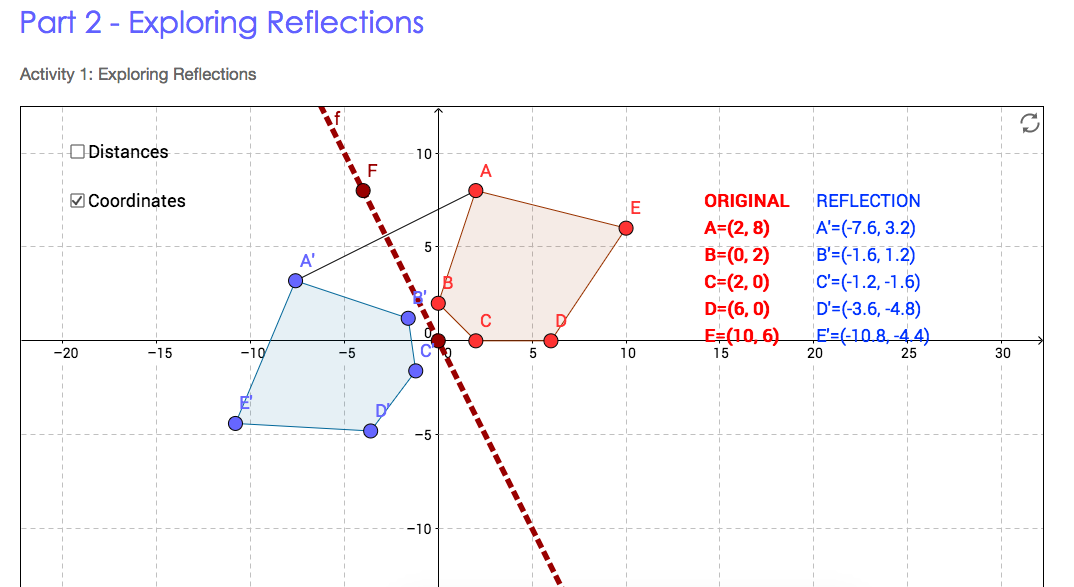
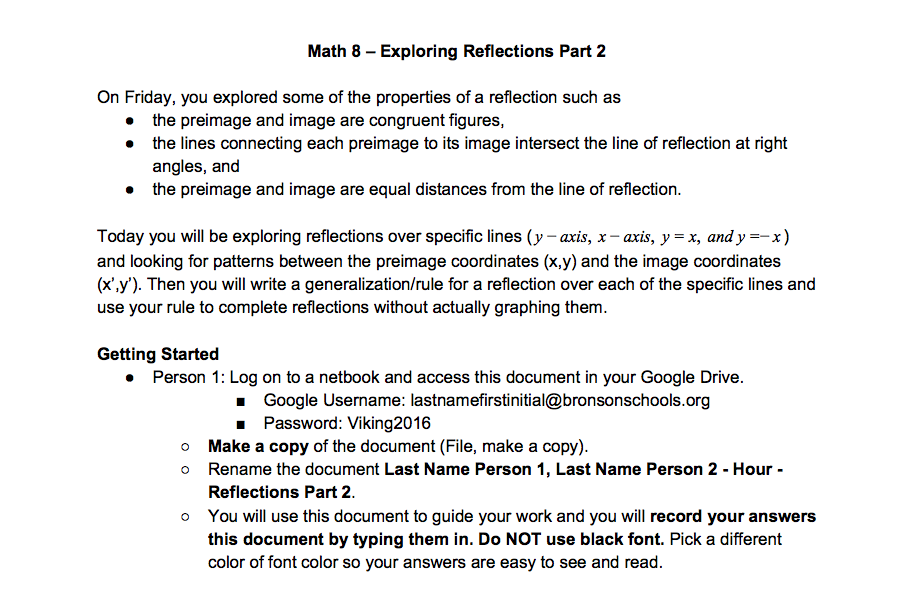
Click on the image above to access a PDF of actual student work for the Part 2 - Exploring Reflections activity.
|
